

Read the Overview
Choose the period and the records to count, read what each chart on the Overview counts, and open the records behind a figure.
The Overview is the first page of a property. Read it to see how consent is going: the full-grant rate, banner answers, withdrawals and where people agree. Every chart says how it is counted and leads to the records behind it.
Set the period and the records#
- Open Overview. The charts count the property chosen in the scope header.
- Choose a period: 7 days, 30 days, 90 days, 12 months or Custom….
- To see the change against the period before, turn on Compare with the previous period.
- Choose the records to count: Live and test, Live evidence or Sandbox (test keys).
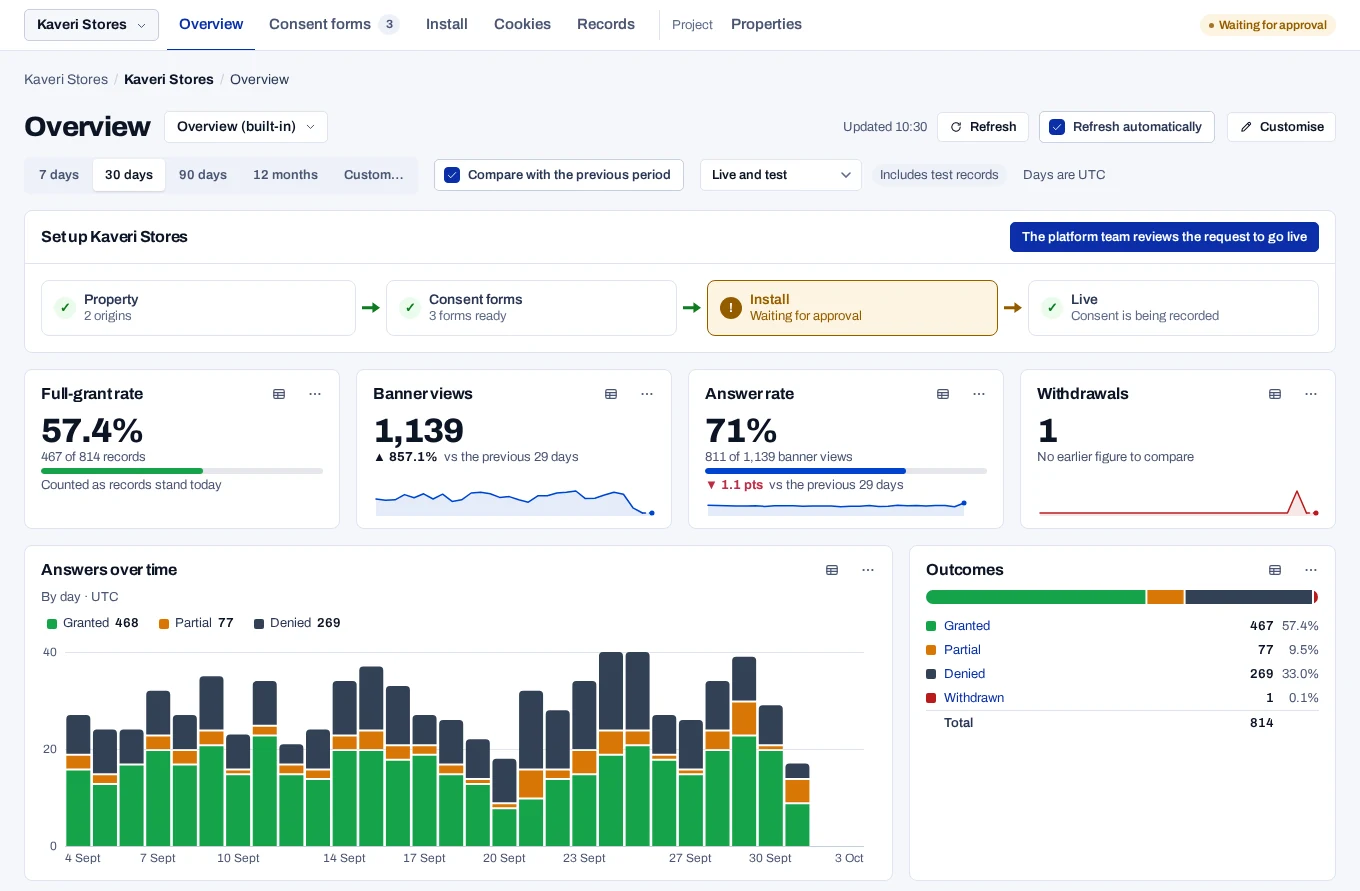
Days are UTC. 30 days is today and the 29 days before it. While Refresh automatically is on, the charts update about once a minute. The address keeps these choices, so a copied link opens the same period and records.
Read a chart#
- Point at a bar, a point or a row to read its figure. On the keyboard, move to the chart and use the arrow keys.
- To read every figure, choose the table button beside ⋯, or ⋯ and then View as table.
- To see how it is counted, choose ⋯ and then How this is counted.
- To list the records behind a figure, click its bar or row, or choose the link in ⋯, such as Open the granted records.
A link may list more records than the chart counted. Its note in the menu says why, such as Also lists records waiting for confirmation.
A chip beside a title marks a chart that does not follow the page. Now is counted as things stand. Whole project covers every property. Last 90 days only was shortened.
Two kinds of figure#
Some charts count records by what they are today: Full-grant rate, Outcomes and the charts by country, by form and by purpose. A record collected in the period that was withdrawn since no longer counts as granted.
Other charts count activity per UTC day: Answers over time, Banner views, Answer rate and Withdrawals. Each answer counts as it was given, and the daily totals update hourly.
The two answer different questions, so they do not add up to each other. A figure counted by today's status has no history, so it has no line over time. For the trend, use Full-grant rate over time, as answered.
Small samples and Other#
- A rate out of fewer than 30 is drawn as an outline and says it can swing widely.
- On some rates, fewer than 10 records show no figure at all.
- A breakdown shows its largest groups and adds the rest as Other.
- A rate for Other or a total is worked out from the counts, never as an average of rates. A total counts only the days, weeks, months and groups that have a rate, so answers in one without banner views add nothing to Answer rate.
Alerts and usage#
Problems, the set-up path and grants about to expire appear above the charts. All clear, Usage this month and How we count appear below them. They stay on every dashboard.
Related#
- Customise your dashboard, to choose the charts
- Dashboard measures, for what each chart counts
- Overview and dashboard problems
- Read a record