

Customise your dashboard
Add, change, move and resize the charts on your Overview, keep several dashboards, start from a starter and download a chart.
Make the Overview show the charts you need. Your dashboards are yours alone: other people in the project do not see them, and their changes never reach yours. On a phone the Overview is view only.
Add a chart#
- On Overview, choose Customise. The edit bar appears above the charts.
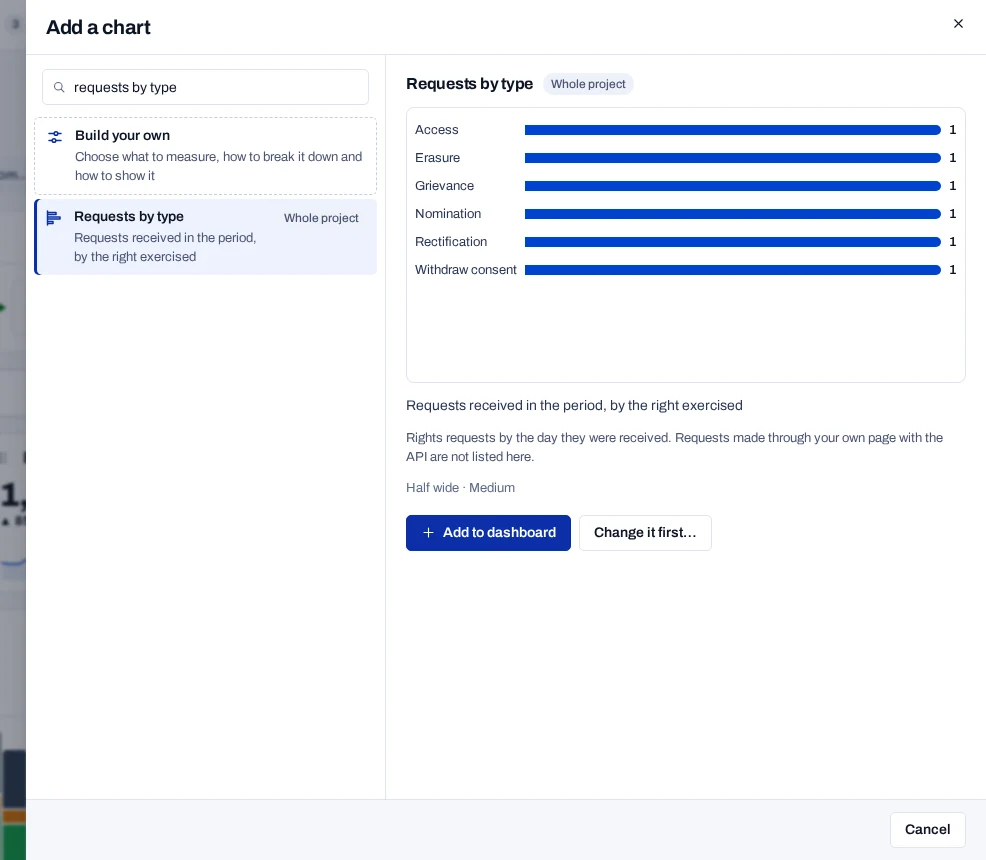
- Choose Add chart.
- Type in Search charts, such as "requests by type", or browse the groups. The preview draws the chart from your data.
- Choose Add to dashboard, or Change it first… to open the builder.
- Choose Done to save.
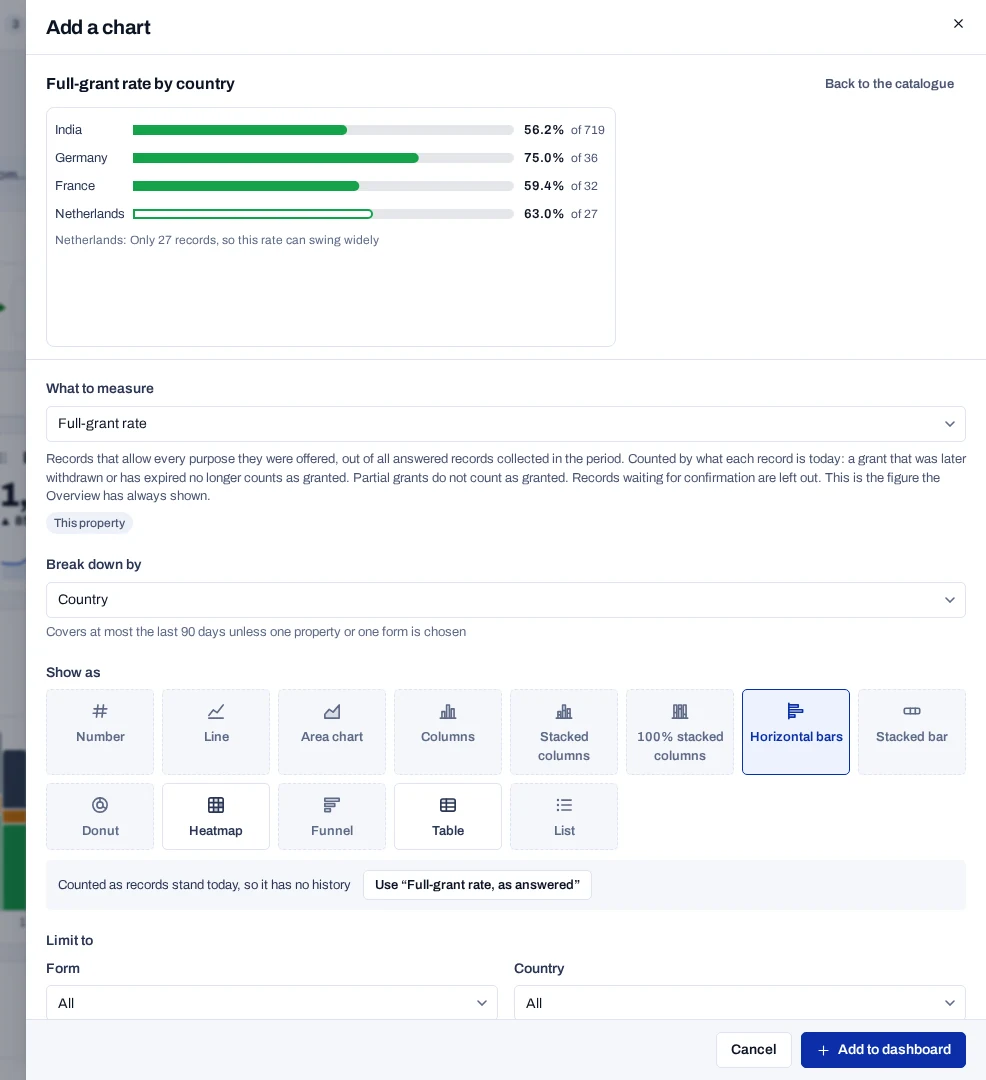
To make a chart of your own, choose Build your own. Pick What to measure, Break down by and Show as. The builder offers only choices that work together, and a chart type it refuses says why. Limit to narrows the chart to one form or one country.
Under Period, Its own period and records lets a chart ignore the page controls. A chip on the chart then says so. Dashboard measures lists every choice.
Change, move and resize#
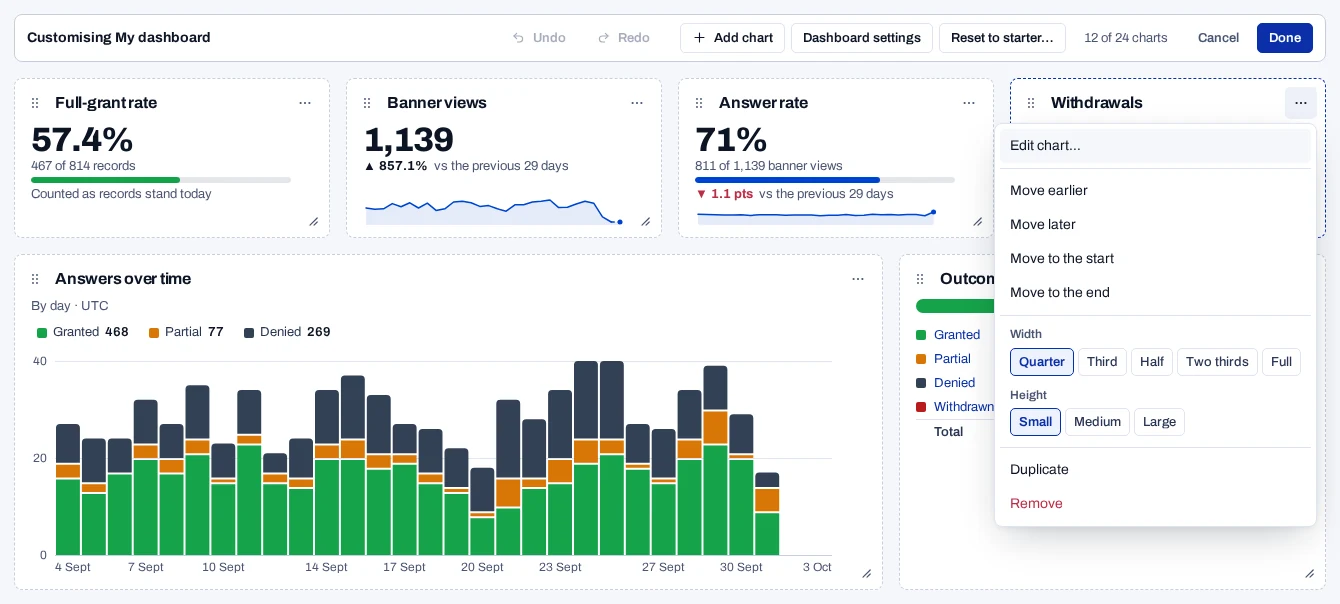
After Customise, every chart has a grip at the top left, a corner at the bottom right and a menu, ⋯.
| To | In the menu | With the mouse |
|---|---|---|
| Change a chart | Edit chart…, then Done in the drawer. Revert undoes the change | No |
| Move it | Move earlier, Move later, Move to the start or Move to the end | Drag the grip |
| Resize it | Width, from Quarter to Full, and Height: Small, Medium or Large | Drag the corner |
| Copy or remove it | Duplicate or Remove | No |
On the keyboard, press Enter on a grip to pick the chart up. Move it with the arrow keys and press Enter again to drop it. The arrow keys on a corner change the size.
Undo and Redo work until you choose Done, and so do Ctrl+Z and Ctrl+Y. Cancel asks before it discards your changes. Edit chart… in a chart's menu also works outside edit mode and starts it for you.
Keep several dashboards#
- Open the dashboard menu beside the Overview heading.
- Choose New dashboard….
- Type a Name. Under Start from, choose Default, Privacy lead, Marketer, Developer or Blank.
- Choose Create.
You can keep 10 dashboards in each project. Manage dashboards… renames, copies and deletes them, and Make default picks the one that opens first. The first time you save the built-in Overview, your copy is named My dashboard and opens first from then on.
Reset, settings and downloads#
- Reset to starter… in the edit bar puts back the charts of a starter. You can undo it until you choose Done.
- Dashboard settings sets the name, the Colours and what the page shows When the dashboard opens. Status colours stay the same in every palette.
- Download CSV in a chart's menu saves its figures, with the period, the records counted and the property on every row.
- Download PNG saves a picture of the chart. Lists cannot be downloaded.
Who sees your dashboards#
Your dashboards are kept on the server for you and this project. Nobody else in the project sees them, and you do not see theirs. A link copied from your Overview opens the other person's own default dashboard, for the same period. Saving a dashboard is not written to the audit log.
Related#
- Read the Overview
- Dashboard breakdowns and charts, for the charts each measure can use
- Overview and dashboard problems
- Accessibility, for keyboard use